OneEnergy Multi-Site Intelligence
End-to-end energy optimization platform unifying multi-brand meters across multiple sites, providing AI-driven insights for tenants and automated monthly reporting with carbon footprint tracking.

Multi-Site Energy Management Complexity
Managing energy across multiple properties with disparate meter systems created visibility gaps, inefficiencies, and compliance headaches.
Multi-Brand Meter Chaos
Energy meters from different manufacturers with incompatible protocols, making unified monitoring impossible.
Multi-Site Visibility Gap
No consolidated view across multiple properties, preventing portfolio-wide optimization and benchmarking.
Reactive Operations
Abnormalities discovered only after costly damage, with no predictive intelligence for prevention.
Manual Reporting Burden
Monthly reports required days of manual data collection and spreadsheet manipulation.
Unified Energy Intelligence
Hardware-agnostic platform that connects any meter brand, providing comprehensive insights, AI recommendations, and automated compliance reporting.
See OneEnergy in Action
From real-time monitoring to AI-powered recommendations, explore the complete energy management workflow.
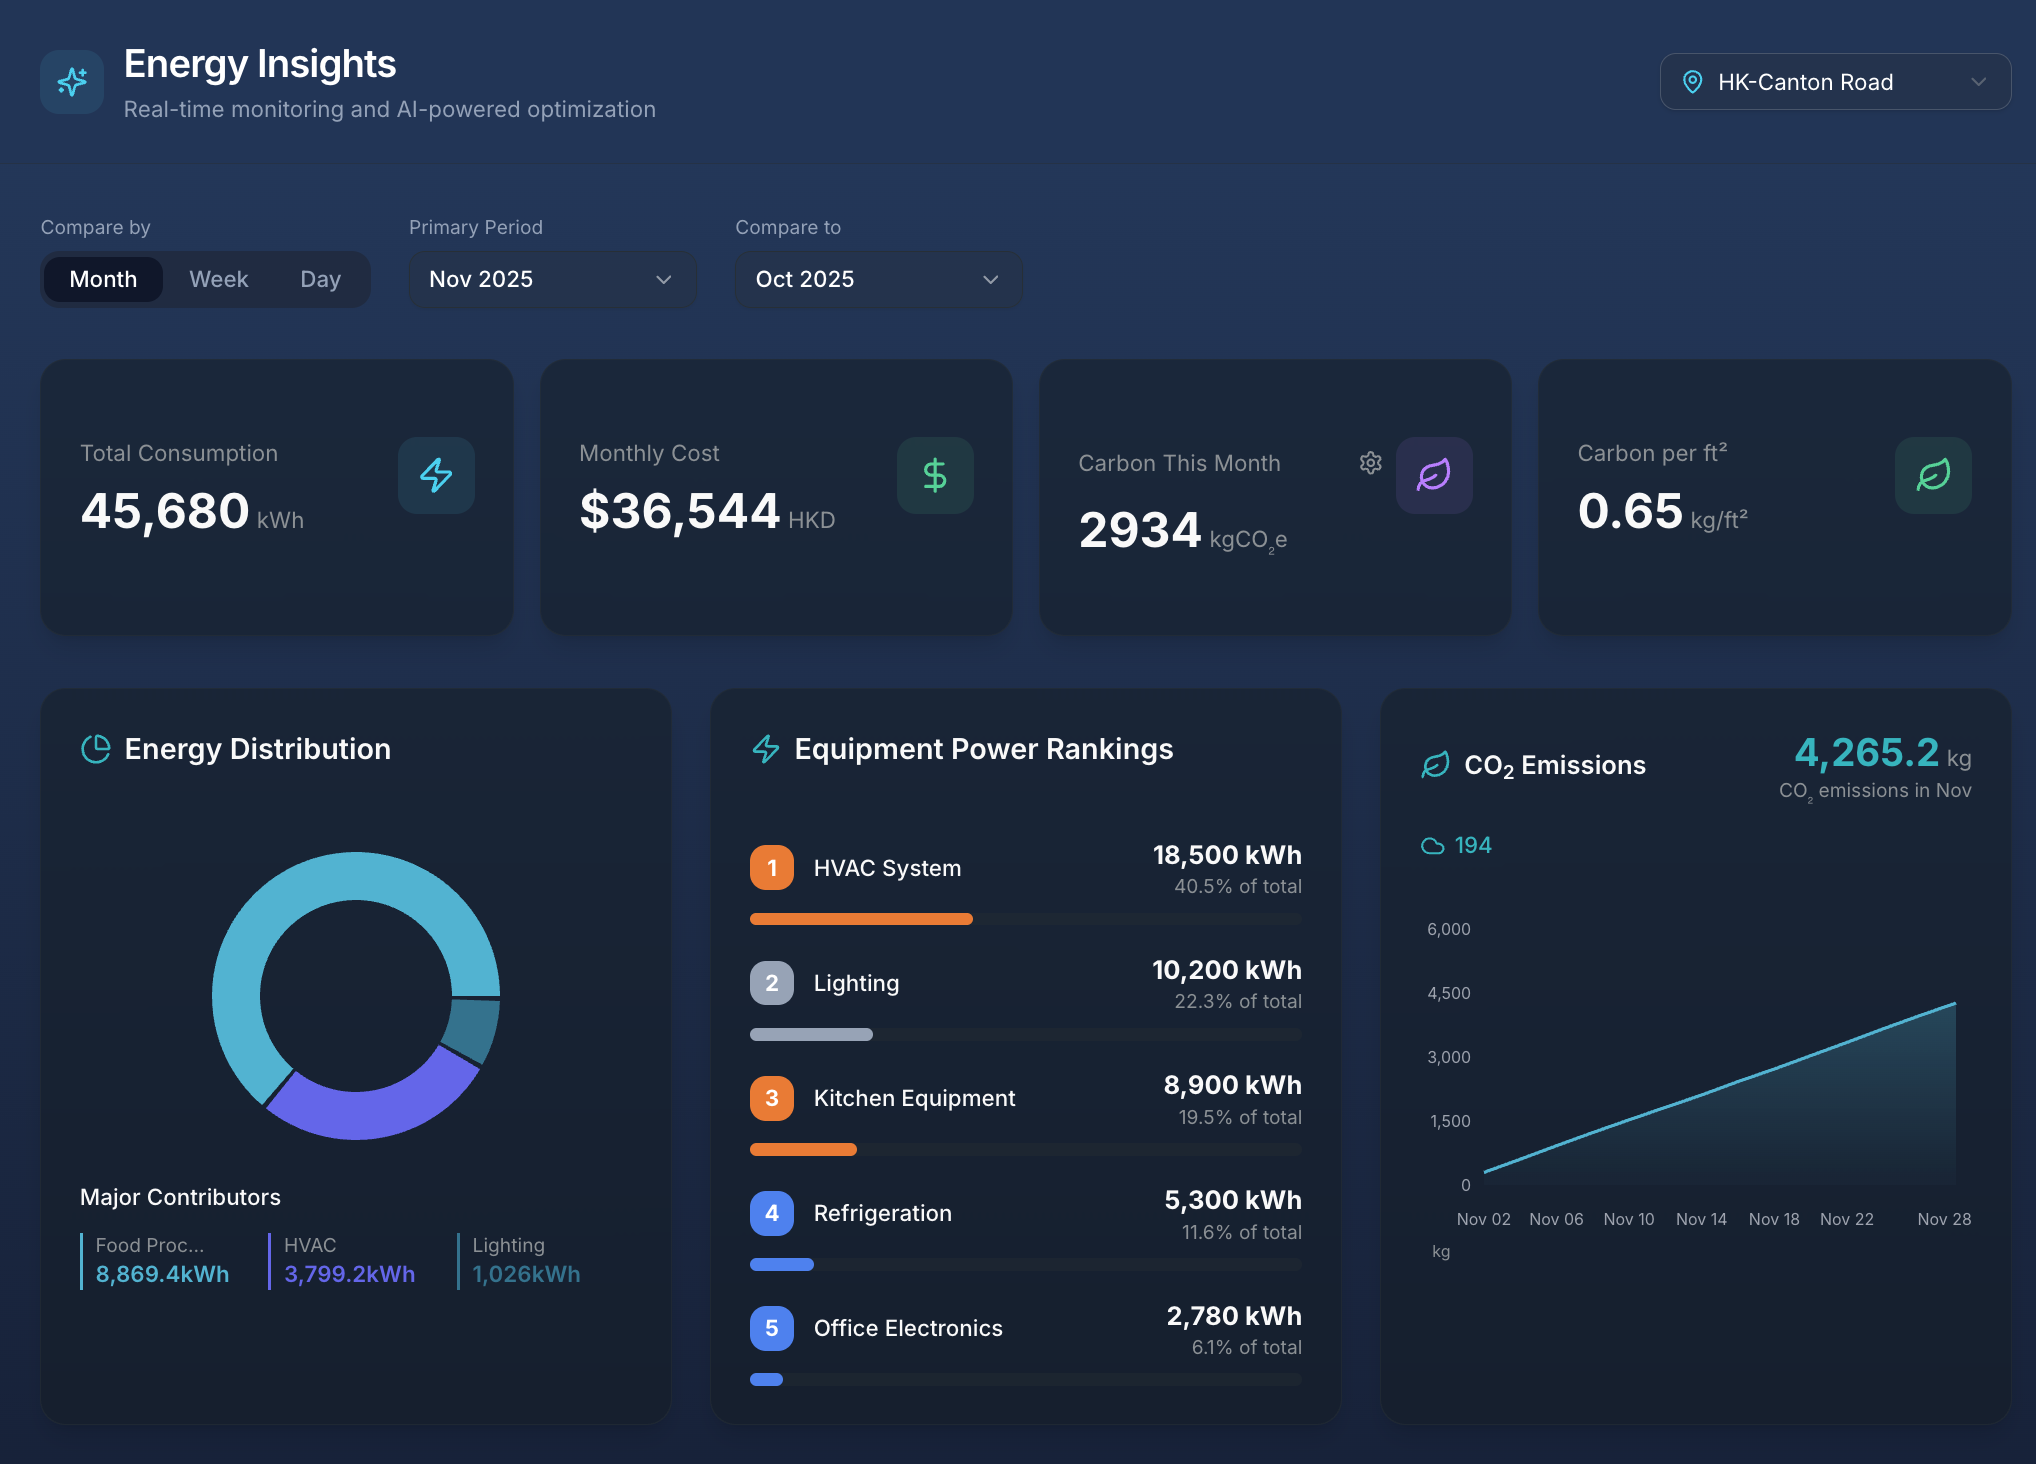
Energy Insights Dashboard
Comprehensive overview with consumption metrics, carbon footprint tracking, equipment power rankings, and CO2 emissions trends across all sites.
- 45,680 kWh total consumption monitoring
- Carbon footprint: 2,934 kgCO2e/month
- Equipment power rankings by category
- Multi-site comparison and benchmarking
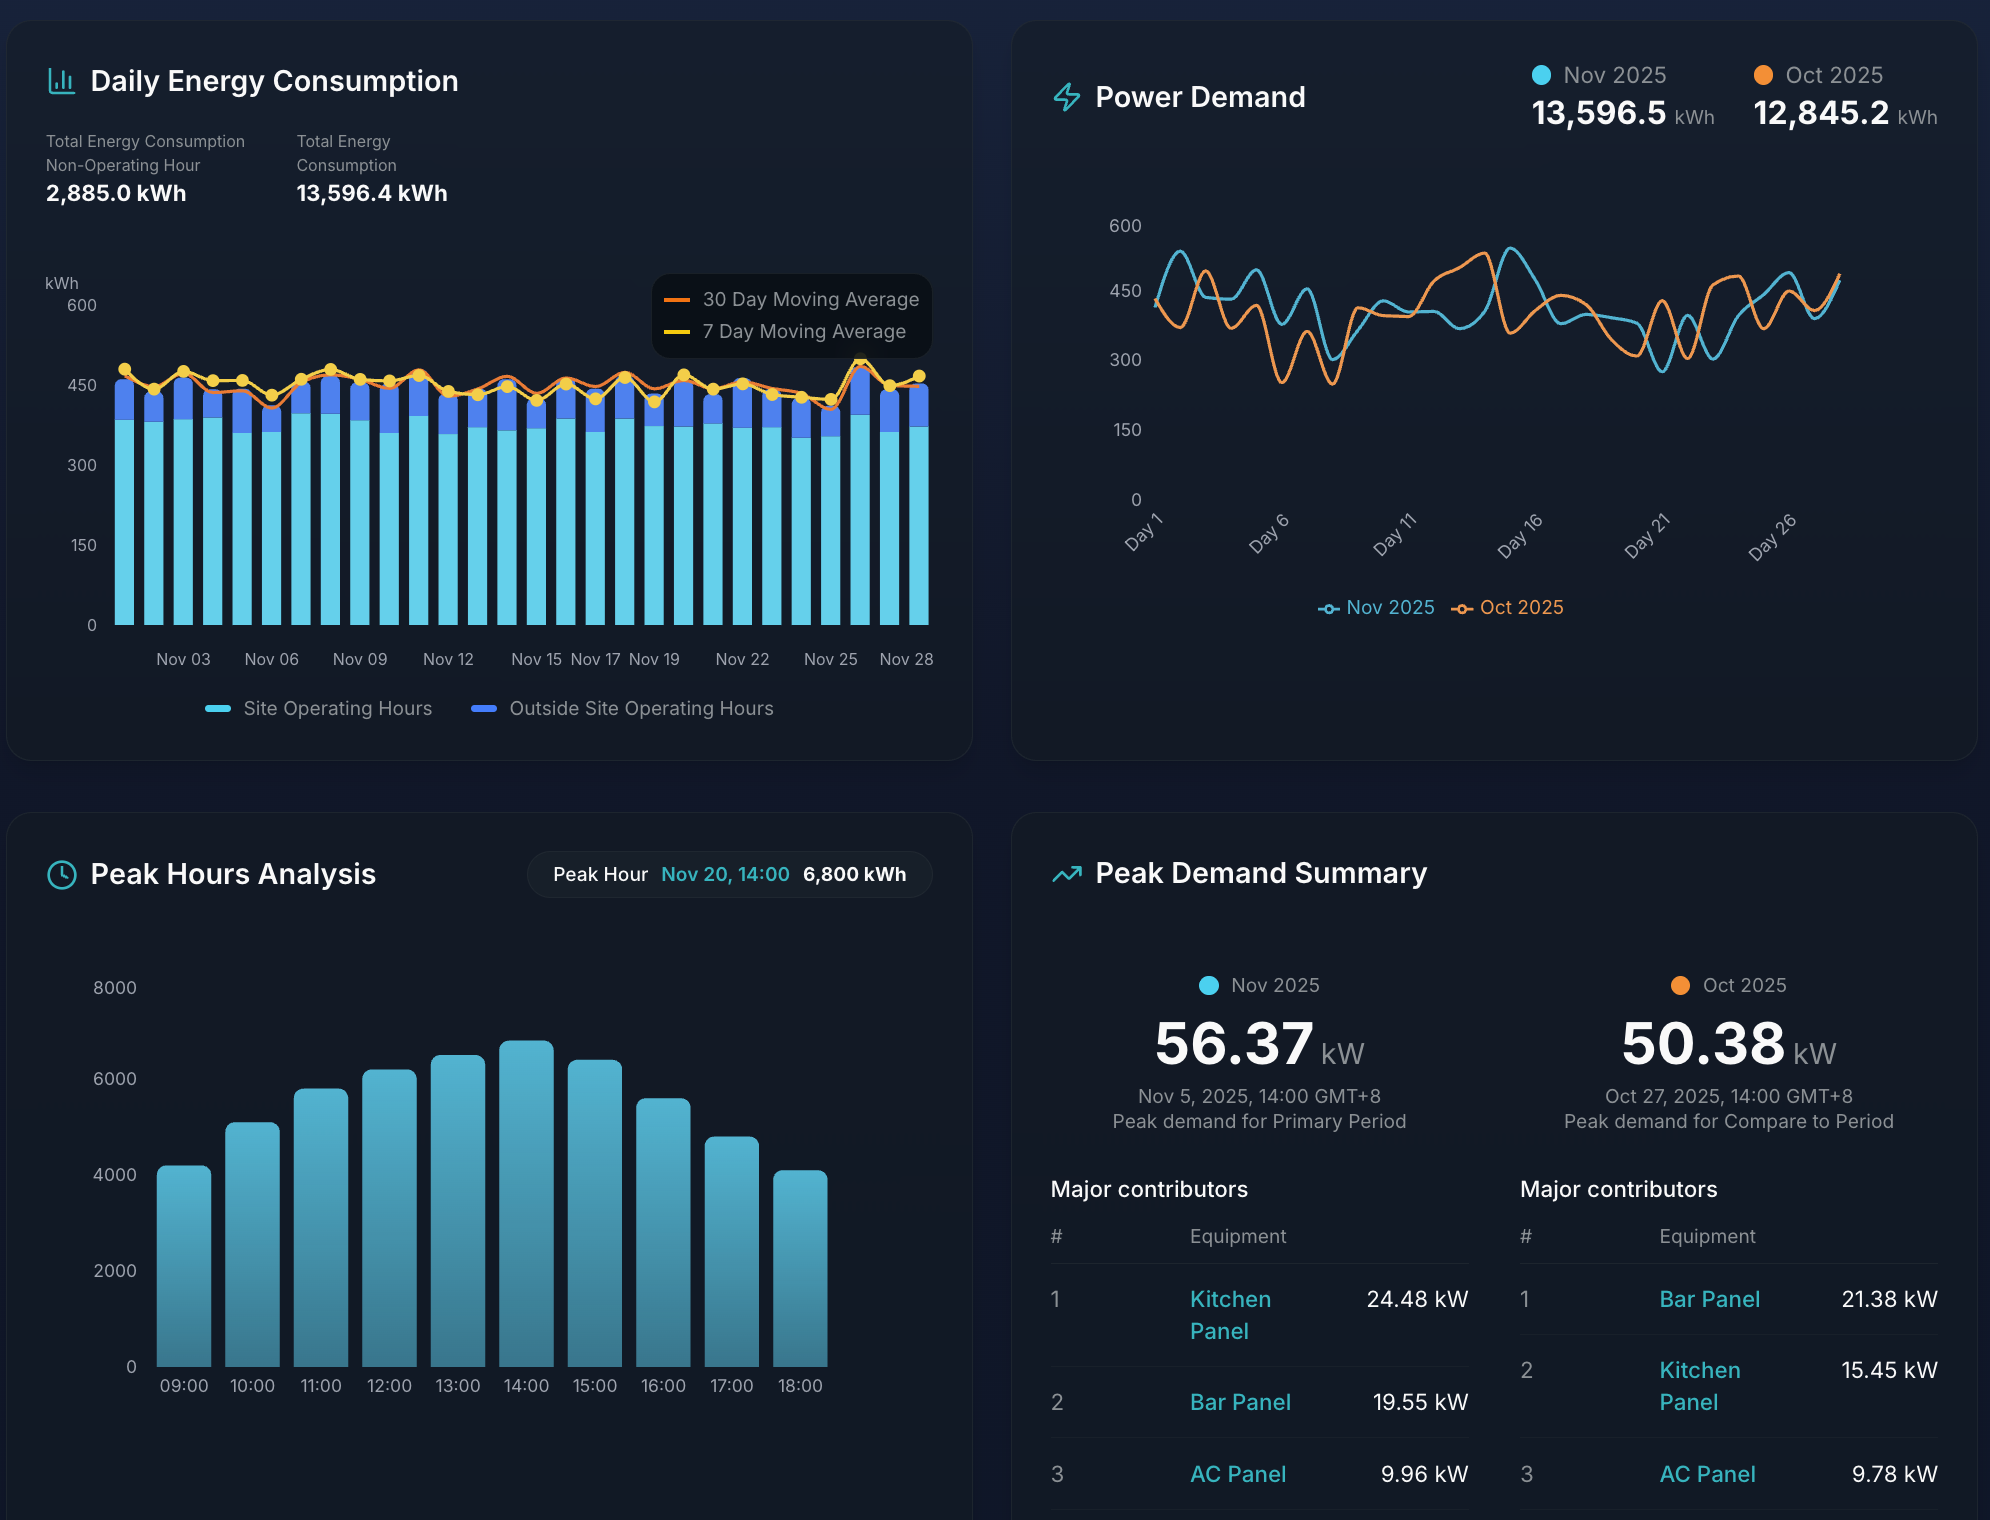
Daily Energy Analytics
Detailed consumption patterns separating operating hours vs non-operating hours, with peak demand analysis and major contributor identification.
- Operating vs non-operating hour breakdown
- 30-day and 7-day moving averages
- Peak hours analysis with timestamp
- Equipment-level demand attribution
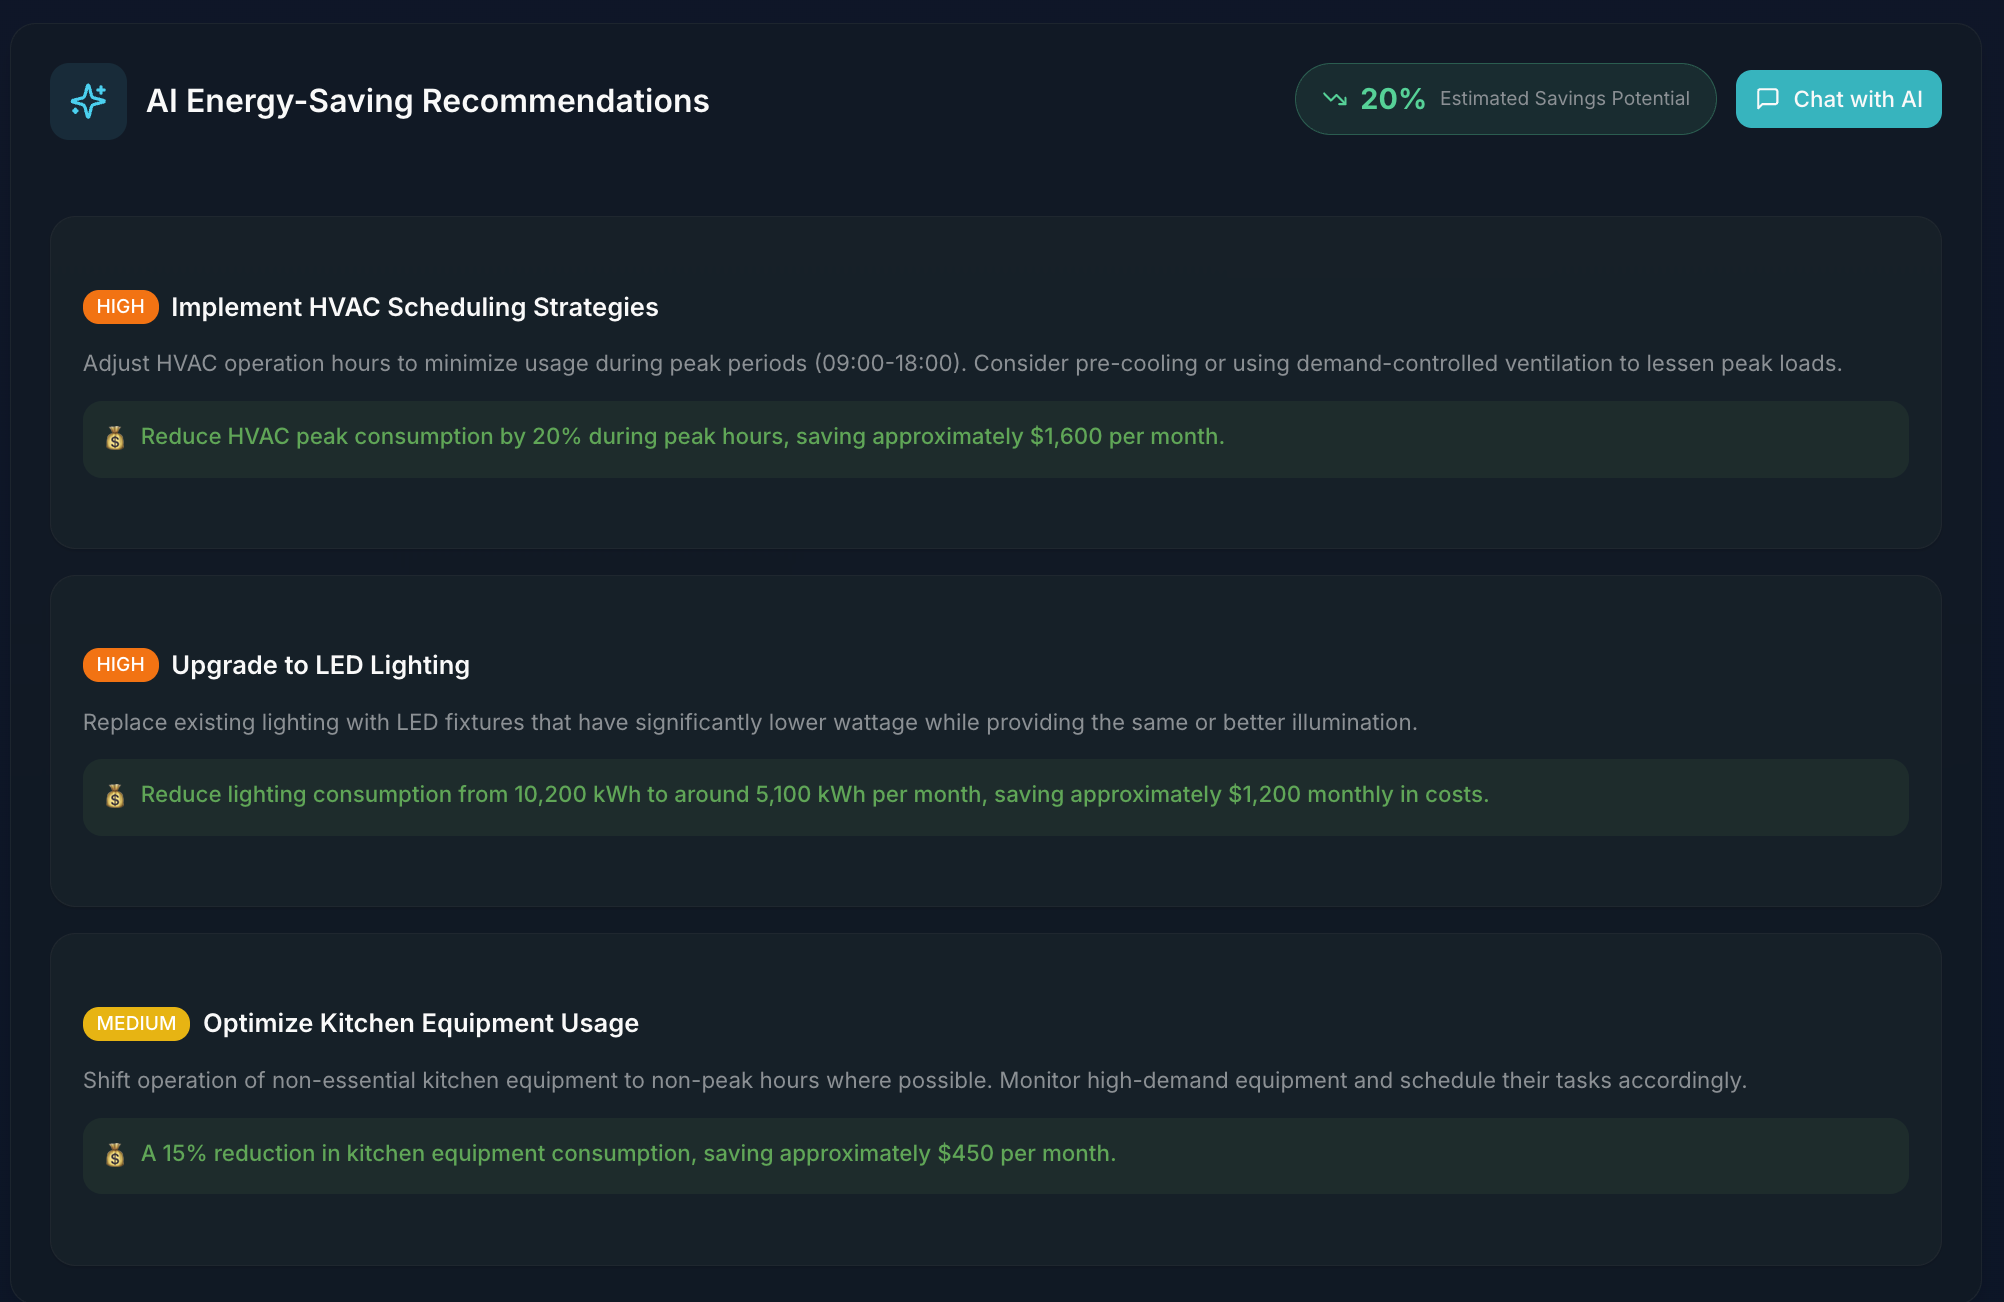
AI Energy-Saving Recommendations
Machine learning powered suggestions prioritized by impact, with estimated savings and actionable implementation guidance.
- 20% estimated total savings potential
- Priority-ranked recommendations (HIGH/MEDIUM)
- Dollar-value savings per suggestion
- Chat with AI for deeper analysis
Empower Your Tenants
Provide tenants with their own energy insights dashboard, helping them understand consumption patterns and reduce their carbon footprint.
Consumption Visibility
Real-time and historical usage data with equipment-level breakdown
Carbon Reporting
Track CO2 emissions per square foot for sustainability goals
Monthly Reports
Automated reports with trends, comparisons, and recommendations